
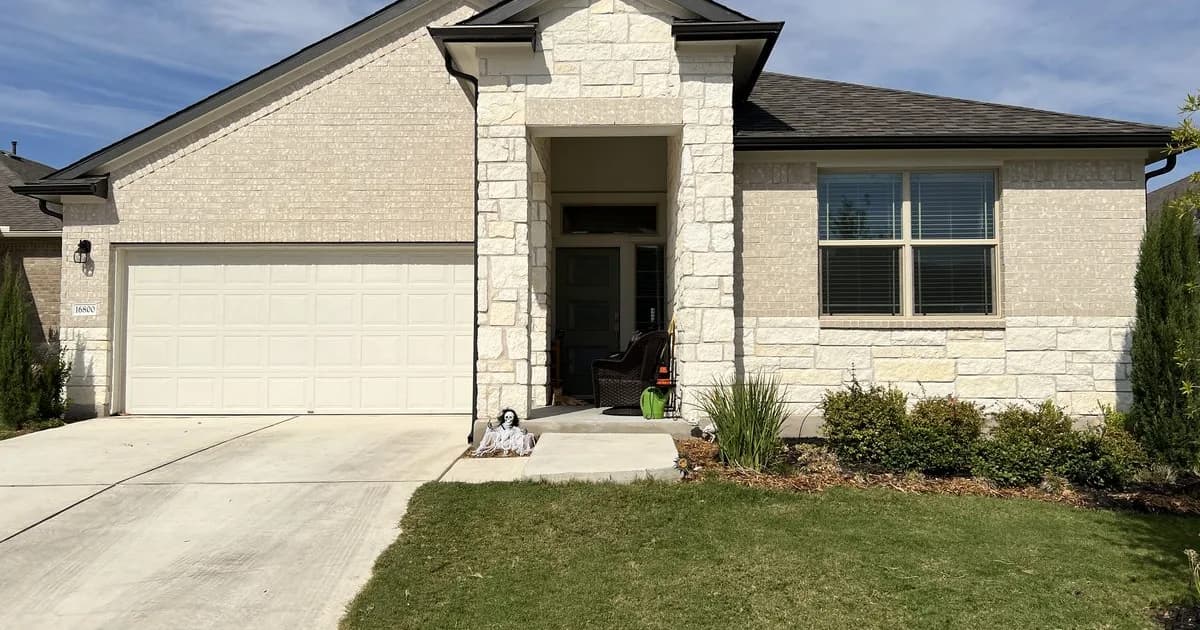
Average Rent in Austin (2026): What a Single-Family Home Actually Rents For
The average rent in Austin was $1,622 a month in August 2026, but a single-family house across the metro averaged $2,312, and that gap is your number.
 Flat Fee Landlord TeamJune 9, 2026Updated September 17, 202614 min read
Contents▾
- The Short Answer
- What Is the Average Rent in Austin, Texas in 2026?
- Why the Metro Average Is the Wrong Number for a House
- Why Are Austin Apartment Rents Down While House Rents Recovered?
- Average Rent by Austin-Area City
- Average Rent in Austin by Bedroom
- Rent by Bedroom and Suburb
- Is the Austin Rental Market Still Falling?
- Should You Lower Rent or Hold?
- When Concessions Beat a Rent Cut
- How to Price an Austin Rental Right
- Frequently Asked Questions
- Sources & Last Reviewed
The average rent in Austin was $1,622 a month in August 2026, but a single-family house across the metro averaged $2,312, and that gap is your number.
Free Instant Rent Estimate
What could your property rent for?
Enter your property address and see an instant comps-based rent estimate — right here, no waiting.
Short answer: The average rent in Austin was $1,622/mo across the metro and $1,586/mo in the city itself in August 2026 (Zillow Observed Rent Index), up 0.3% and 0.1% year over year. Both are apartment-weighted, and neither is your number if you own a house. A single-family home across the Austin metro averaged $2,312/mo in the same month — $690 above the metro figure, up 1.4% on the year, and within $2 of its all-time high. The apartment glut that made the headlines barely touched single-family rentals.
Want the number for your specific address? The metro average is a starting point, not a price. We will pull live comps for your street, bedroom count, and finish level.
Get your free Austin rent analysis →What is the average rent in Austin, Texas in 2026?
$1,622 a month across the Austin metro and $1,586 in the city of Austin, as of August 2026. Those are Zillow Observed Rent Index figures, the most recent month published as of this writing. They are also the numbers that get quoted everywhere and the numbers most likely to cost an Austin owner money.
The Zillow Observed Rent Index is a repeat-rent measure of asking rents on Zillow listings, smoothed and seasonally adjusted, reported for the 35th to 65th percentile of the market. The headline version blends every rental housing type together. The single-family-only version does not, and in Austin the two tell different stories.
| Measure | August 2026 | August 2025 | Year over year |
|---|---|---|---|
| Austin metro, single-family homes only | $2,312 | $2,279 | +1.4% |
| United States, single-family homes only | $2,289 | $2,220 | +3.1% |
| United States, all rental housing types | $1,948 | $1,898 | +2.6% |
| Austin metro, all rental housing types | $1,622 | $1,618 | +0.3% |
| City of Austin, all rental housing types | $1,586 | $1,585 | +0.1% |
Two things in that table deserve a second look. First, the gap: $690 a month between the metro all-homes average and the metro single-family average, and $726 against the city-of-Austin figure. Second, Austin metro single-family rent is above the national single-family average, which is not the impression anyone would take from two years of coverage about Austin rents collapsing.
Why the metro average is the wrong number if you own a house
An all-homes rent average is a weighted blend of every rental housing type in a market, and in Austin that blend is dominated by professionally managed apartments. A single-family rent index measures detached houses: yards, garages, driveways, school attendance zones, a separate roof. They are two different products measured two different ways.
So when an Austin owner reads "average rent $1,622" and prices a four-bedroom in Cedar Park off it, the mistake is not small. It is most of a mortgage payment, every month, for the length of the lease. The same trap catches owners in the other Texas metros we manage in, where the average rent in Dallas and Fort Worth understates a house by $718, the average rent in Houston spans a 50% range between Sugar Land and Pasadena, and the average rent in San Antonio hides a 93% spread inside the city limits alone.
One sanity check before you trust any rent figure you read: ask what it is an average of. If the answer is "all rentals" and you own a house, add the spread. If the answer is "asking rents on new leases" and you are setting a renewal, remember that renewals almost always price below new-lease asking rents. If nobody can tell you what it is an average of, do not price off it.
The practical rule: match the comp to the asset. Same bedroom count, same submarket, same finish level, actively listed or leased in the last 60 days. Not a metro index, including the one in the table above.
Why are Austin apartment rents down while house rents recovered?
Because Austin has been running two rental markets at once, and only one of them absorbed a supply shock. Austin built more apartments faster than anywhere else in the country. It did not build a comparable wave of rental houses.
Put the two Zillow series side by side over four Augusts and the split is stark.
| August | Austin metro, single-family | Austin metro, all homes |
|---|---|---|
| 2022 | $2,303 | $1,792 |
| 2023 | $2,302 | — |
| 2024 | $2,280 | — |
| 2025 | $2,279 | $1,618 |
| 2026 | $2,312 | $1,622 |
| Four-year change | +0.4% | −9.4% |
Same metro, same four years, two completely different outcomes. Austin metro single-family rent peaked at $2,314 in November 2022, bottomed at $2,269 in October 2024, and at $2,312 in August 2026 it has recovered to within $2 of its all-time high. The apartment-weighted index has not come close: it is still 9.4% below its August 2022 level.
Both are rising now. The all-homes index bottomed around $1,600 in February 2026 and has climbed in every month since — $1,600 in April, $1,605 in June, $1,613 in July, $1,622 in August. Single-family has risen in six of the eight months of 2026. The Austin rent decline that dominated two years of headlines is over; what is left is a slow, uneven recovery in which houses started from a much stronger base.
Average rent by Austin-area city (August 2026)
City-level rent in Central Texas varies far more than the metro average suggests, and the direction of travel varies with it. The table below is the August 2026 Zillow Observed Rent Index for every Austin-metro city Zillow publishes. One caveat to carry into it: Zillow publishes its single-family-only index at metro level but not by city, so every figure here is an all-homes number. Use it to rank cities against each other, not to price a house.
| City | August 2026 | Year over year |
|---|---|---|
| Lakeway | $2,572 | +3.2% |
| Dripping Springs | $2,324 | +5.1% |
| Liberty Hill | $2,227 | −0.7% |
| Taylor | $2,002 | −1.4% |
| Leander | $1,899 | +1.6% |
| Elgin | $1,774 | +1.8% |
| Hutto | $1,753 | +2.7% |
| Round Rock | $1,741 | +1.3% |
| Cedar Park | $1,727 | +2.2% |
| Del Valle | $1,649 | −2.9% |
| Manor | $1,642 | −3.1% |
| Pflugerville | $1,639 | +0.2% |
| Georgetown | $1,621 | +2.3% |
| Buda | $1,593 | −2.5% |
| Austin | $1,586 | +0.1% |
| Kyle | $1,555 | −3.2% |
| San Marcos | $1,428 | −0.2% |
The pattern is worth reading carefully, because it is not the one most Austin owners expect. The Williamson County suburbs are the ones growing: Hutto at +2.7%, Georgetown at +2.3%, Cedar Park at +2.2%, Leander at +1.6%, Round Rock at +1.3%. The declines are concentrated south and east of the city — Kyle at −3.2%, Manor at −3.1%, Del Valle at −2.9%, Buda at −2.5% — where the newest apartment supply landed hardest relative to the size of the existing stock. Lakeway and Dripping Springs lead the metro on both level and growth.
For a more granular view of how sharply rent levels change between adjacent ZIP codes, we maintain an Austin rent report built from Department of Housing and Urban Development Small Area Fair Market Rent data. It measures something different — the 40th-percentile gross rent used as a housing-assistance benchmark, not an asking price — but it is the best public source for ZIP-level variation in the metro.
Average rent in Austin by bedroom
Neither Zillow nor any government source publishes a verified bedroom-by-bedroom rent average for Austin, so the best available figures are listing medians from a commercial source. These are Zumper's Austin medians as of June 27, 2026 — older than the Zillow data above, and included because they show a split the metro average hides entirely:
| Unit type | Median asking rent | Year over year |
|---|---|---|
| Studio | $1,175 | −26% |
| 1 bedroom | $1,302 | −13% |
| 2 bedroom | $1,668 | −18% |
| 3 bedroom | $2,250 | −21% |
| 4 bedroom | $2,900 | +7% |
The four-bedroom line is the one worth staring at. Every smaller unit type fell by double digits and the largest homes gained. New apartment supply competes with studios and one-bedrooms. It does not compete with a four-bedroom house in a good school zone, which is the same conclusion the Zillow single-family series reaches from completely different data.
Rent by bedroom and suburb
Bedroom count and submarket interact, and no index captures that. The table below is drawn from Rentometer Atlas data pulled on July 1, 2026, covering the Austin-area cities we manage in. Medians, not averages, so a handful of luxury listings cannot distort the figure:
| Suburb | All homes | 3 bedroom | 4 bedroom | Sample size |
|---|---|---|---|---|
| Lakeway | $3,250 | $2,700 | $3,792 | 218 |
| Bee Cave | $2,476 | $2,989 | $3,948 | 94 |
| Cedar Park | $2,200 | $1,870 | $2,699 | 500 |
| Leander | $2,200 | $1,972 | $2,495 | 500 |
| Buda | $2,150 | $2,225 | $2,400 | 102 |
| Pflugerville | $2,150 | $2,094 | $2,485 | 500 |
| Georgetown | $2,098 | $1,970 | $3,054 | 500 |
| Hutto | $2,075 | $1,836 | $2,200 | 500 |
| Round Rock | $2,000 | $1,995 | $2,237 | 500 |
| Manor | $1,997 | $1,993 | $2,560 | 146 |
| Kyle | $1,945 | $1,828 | $2,100 | 500 |
| Dripping Springs | $1,926 | $2,530 | — | 39 |
Reading this table honestly: sample size matters, and this is listing data from a different source and an earlier month than the Zillow figures above, so the two will not reconcile line by line. Cities at 500 samples are reliable; Dripping Springs (39) and Bee Cave (94) are thin, and Dripping Springs had too few 4-bedroom listings to publish a median at all. Where a 3-bedroom median exceeds a 4-bedroom median, or the median runs above the mean (Georgetown), the local mix is skewed by a cluster of higher-end listings — another reason to price off live comps rather than any table, including this one.
Is the Austin rental market still falling?
No. Both Austin rent indices bottomed and have been rising through 2026. The metro all-homes index has climbed every month since February, and single-family rent is back within $2 of its all-time high. What remains is a market with a lot of empty apartments still working through the system.
Austin's multifamily vacancy sat at roughly 13.3% in Q2 2026, third-highest among major U.S. markets. But deliveries have collapsed from a peak of more than 32,100 new units in the twelve months to late 2025 down to about 12,700 in the twelve months to Q2 2026. The supply wave that caused the discounting is thinning, which is exactly what the rent indices started registering in the spring.
One number owners should still know: 64.3% of Austin rental listings offered a concession in June 2026, against 39.7% nationally — the most concession-heavy major market in the country, and the most recent Austin-specific concession figure we have verified. That is what you are competing against on a vacant home, and it is why presentation and speed now matter as much as price.
Should you lower rent or hold?
It comes down to one question: is your asking price above today's comps, and how long has the home sat?
- Hold if your price already matches current comparable houses and the home is freshly listed. Give a correctly priced home about two weeks before reacting.
- Adjust if it has been listed more than about two weeks with few qualified applications. That is the market telling you the price is too high.
- Never chase the market down blindly. Cutting before you have pulled live house comps leaves money on the table just as easily as overpricing leaves the home empty.
The arithmetic is unsentimental, and most owners get it backwards. Take a $2,312 house, the metro single-family average. List it at $2,450 because a neighbour got that last spring, and it sits an extra five weeks before you cut back to market. Five weeks of vacancy on $2,312 is roughly $2,700 of rent you will never collect. To recover that through the $138 monthly premium you were chasing, you would need it to hold for nearly two years — and you do not get it at all, because you ended up leasing at market anyway.
Run it the other way and the asymmetry is just as stark. Listing $50 below where you think the market is costs you $600 over a twelve-month lease. Being wrong by five weeks of vacancy costs four and a half times that. In a market where a renter can walk down the street to a lease-up offering free months, the cost of being slightly ambitious is measured in weeks of vacancy, not in dollars of rent.
When a concession beats a rent cut
With nearly two-thirds of Austin listings already offering something, concessions are table stakes — and they are usually the better tool. A one-time incentive wins the tenant now while protecting your face rent, the number every future renewal is calculated from.
Compare the two over a typical hold: a permanent $150/month cut lowers your rent on this lease and every renewal after it. A one-time two-week concession costs about the same once, but your lease still renews from the higher number. Over a three-year tenancy that difference compounds into thousands — and when the market turns back up, Texas rent increase laws put no cap on how far you can move that face rent at renewal.
How to price an Austin rental right in 2026
Pricing is the highest-leverage decision an Austin landlord makes this year. A disciplined process:
- Price off live house comps, not last year's rent or a metro index. Actively listed and recently leased homes, tight radius, matching bed and bath.
- Check the school attendance zone, not the city. This is the largest single swing factor in Central Texas and it does not respect city limits. Two houses a mile apart in Round Rock can feed different elementary schools and price $200 apart.
- Lead the market by a hair. At 13% multifamily vacancy, being the best-priced home in your micro-neighborhood is what earns the showing.
- Decide your concession in advance. Know what you will offer before a prospect asks, so you are not negotiating against yourself.
- Present the home to win. Professional photos, an accurate listing, and same-day response matter more when renters have thousands of other options.
- Time it if you can. April through August is when the largest pool of qualified renters in the Austin metro is searching, as families move around the school calendar. A house listed in December competes for a much smaller pool.
- Screen hard even in a renters' market. A soft market is exactly when owners lower their standards and place the wrong tenant. One bad placement — missed rent, damage, an eviction — runs $5,000 to $15,000 and erases years of rent premium.
You own the house and you make the call. What we do is make sure the call gets made on real numbers rather than on a metro average or a hopeful guess — pricing from live comps in your actual ZIP code and school zone across Travis, Williamson and Hays counties, listing with photography that earns the showings, and telling you honestly in week two when the market disagrees with the price.
We charge a flat monthly fee for that, starting at $139/mo on annual billing. Which matters more in a pricing article than it might sound: on a percentage fee, your manager earns more when your rent goes up, which is a strange incentive to attach to the person advising you what to charge. Your management cost should not rise just because your rent did.
If you would rather not run comps yourself, that is the job: start with a free rental analysis, see how Austin tenant placement works, or read more about Austin property management and what property management costs in Austin. Deciding whether to keep the home at all? Start with should I rent or sell my Austin home.
Sources & last reviewed
Last reviewed: September 17, 2026 by the Flat Fee Landlord Central Texas team. Zillow Observed Rent Index figures are from the August 2026 release, the most recent published at that date. Figures from other sources carry their own as-of dates below and are older; we re-verify this page quarterly.
- Zillow Research — Zillow Observed Rent Index, metro and city files, August 2026 release (single-family-only, all-homes, smoothed and seasonally adjusted): Austin metro single-family $2,312; Austin metro all homes $1,622; city of Austin $1,586; United States single-family $2,289; United States all homes $1,948; the full Austin-metro city table; and the August 2022 to August 2026 history.
- Zillow Research — Zillow Observed Rent Index methodology.
- Zillow Research, June 2026 Rent Report — Austin concession share 64.3% vs 39.7% nationally.
- Zumper, Austin TX rent research — as of June 27, 2026: by-bedroom medians.
- Apartments.com, highest-vacancy markets Q2 2026 — Austin 13.3% vacancy (3rd nationally); deliveries 32,100 units (peak, 12mo to late 2025) falling to 12,700 (12mo to Q2 2026).
- Rentometer Atlas, retrieved July 1, 2026 — suburb-level and per-bedroom medians. Rent statistics provided by Rentometer.
- Flat Fee Landlord — Austin Rent Report, ZIP-level analysis of HUD Small Area Fair Market Rent data.
2,000+
Tenants Placed
<1%
Eviction Rate
9–12 Mo
Tenant Guarantee
4.6★
Google Rating
Our Services

Flat Fee Landlord Team
Flat Fee Landlord
The Flat Fee Landlord team helps landlords across Texas and the DMV find great tenants, stay legally protected, and maximize rental income — for one flat monthly fee.
Frequently Asked Questions
What is the average rent in Austin, Texas in 2026?▾
The Zillow Observed Rent Index for the Austin metro was $1,622 a month in August 2026, up 0.3% year over year, and $1,586 for the city of Austin itself. Both are all-homes figures weighted toward apartments. Single-family homes across the Austin metro averaged $2,312 a month in the same month, $690 above the metro figure. If you own a house, the second number is yours.
How much does a house rent for in Austin?▾
The single-family-only Zillow Observed Rent Index for the Austin metro was $2,312 a month in August 2026, up 1.4% year over year. That is above the national single-family average of $2,289 and second among the four big Texas metros, behind Dallas-Fort Worth at $2,371 and ahead of Houston at $2,242 and San Antonio at $1,845. Zillow publishes this single-family series at metro level only, not city by city.
Are rent prices going down in Austin in 2026?▾
Not any more, in either market, though the recovery is uneven. The Austin metro all-homes index bottomed at about $1,600 in February 2026 and has risen every month since to $1,622 in August. Single-family rent bottomed earlier, at $2,269 in October 2024, and at $2,312 in August 2026 it is within $2 of its all-time high of $2,314 set in November 2022. Apartment rent has recovered far less: the metro all-homes figure is still 9.4% below where it stood in August 2022.
How much does it cost to rent a 3-bedroom house in Austin?▾
Zillow does not publish a verified bedroom-by-bedroom average for Austin, so there is no single reliable metro number for a three-bedroom. Zumper put the Austin three-bedroom median at roughly $2,250 a month in June 2026, and Rentometer medians from July 2026 ranged from about $1,828 in Kyle to $2,989 in Bee Cave. Price from live comparable houses in your own submarket and school attendance zone.
Why do Austin rent estimates vary so much between websites?▾
Because they measure different baskets of homes. An all-homes index blends a downtown studio and a four-bedroom in Cedar Park into one number, and there are far more apartments than houses in the mix. A house-weighted sample falls less and recovers sooner than an apartment-weighted one. Before you trust any rent figure, ask what it is an average of.
Should I lower the rent on my Austin rental?▾
Only if your asking price sits above current comparable house listings and the home has been unleased for more than about two weeks. A correctly priced home leases fast even in a soft market; an overpriced one sits, and vacancy costs far more than a modest adjustment. On a $2,312 house, five weeks of vacancy is roughly $2,700 of rent you never collect.
Is it better to drop rent or offer a concession in Austin?▾
A one-time concession usually protects your long-term rent better than a permanent cut, because every future renewal is still calculated from the higher face rent. This matters in Austin, where 64.3% of listings offered a concession as of June 2026, the highest share of any major U.S. market.
How long should an Austin rental take to lease in 2026?▾
No primary source publishes a verified days-on-market figure for Austin leases, so treat any single number you see as an estimate rather than data. Use your own listing as the instrument: if about two weeks of active marketing produce no qualified applications, the price or the presentation is the problem, not the market.
Is Austin still a good rental market for landlords in 2026?▾
For single-family owners, yes. Metro single-family rent of $2,312 in August 2026 is above the national single-family average and back within $2 of its all-time peak, and it grew 1.4% over the year while the apartment-weighted metro index grew 0.3%. The softness in the Austin headlines has been a multifamily story from the start.
You might also like
- Best Neighborhoods to Invest in San Antonio (2026): What the Rent and Price Data SaysSeptember 25, 2026Live Oak, Converse and Universal City lead the San Antonio area on rent-to-value in 2026 while Alamo…
- Can a Landlord Enter Without Permission in Texas?September 18, 2026Texas has no law setting a notice period before a landlord enters a rental, so your lease is the onl…
- Average Rent in Dallas and Fort Worth 2026: What Landlords Can ChargeSeptember 12, 2026Dallas rents averaged $1,605 a month in July 2026 and Fort Worth $1,625, but that average is an apar…
- Average Rent in San Antonio 2026: What Landlords Can ChargeSeptember 11, 2026San Antonio rentals averaged $1,832 a month in August 2026, down 2 percent, and the ZIP code your ho…
Free Instant Rent Estimate
What could your property rent for?
Enter your address — see an instant comps-based rent estimate.
- ⭐ 4.6 stars · 730+ Google reviews
- ✅ 2,000+ tenants placed
- ✅ <1% eviction rate
- ✅ Tenant assurance on eligible bundles